How to configure Readiness Probe alert in Prometheus

DevOps engineer @ unbxd, currently understanding bits of observability & monitoring.
This article aims to explain the steps to configure Readiness Probe failure alert in Prometheus.
Readiness Probe in Kubernetes is a probing mechanism to detect health (ready status) of a pod and if the health is intact, then allow the traffic to the pod.
From the official doc,
Sometimes, applications are temporarily unable to serve traffic. For example, an application might need to load large data or configuration files during startup, or depend on external services after startup. In such cases, you don't want to kill the application, but you don't want to send it requests either. Kubernetes provides readiness probes to detect and mitigate these situations. A pod with containers reporting that they are not ready does not receive traffic through Kubernetes Services.
Hence, to detect readiness probe failure of our apps, lets configure an alert in Prometheus.
Prerequisites :
1. Constructing PromQL expression:
All Prometheus queries / expressions are written in a query language called PromQL. You can read more about how to write promQL queries here.
- The main metrics which gives the status of readiness probe of a pod is :
kube_pod_status_ready. - The metric has a condition label whose value can be false or true.
For the testing of this metric, let's create a Kubernetes deployment with a incorrect readiness probe :
apiVersion: apps/v1
kind: Deployment
metadata:
  name: readiness-test
  labels:
    app: nginx
spec:
  selector:
    matchLabels:
      app: nginx
  template:
    metadata:
      labels:
        app: nginx
    spec:
      containers:
      - name: nginx
        image: nginx
        ports:
        - containerPort: 80
        readinessProbe:
          httpGet:
            host:
            scheme: HTTP
            path: /
            httpHeaders:
            - name: Host
              value: example.com
            port: 50
The complete promQL expression will look like this :
sum by(pod)( kube_pod_info{created_by_kind!="Job"} AND ON (pod, namespace) kube_pod_status_ready{condition="false"} == 1)
Result :
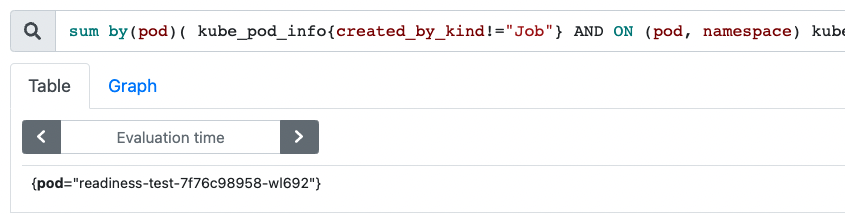
Explanation :
- The below query will filter out all the pods which has failed readiness status.
kube_pod_status_ready{condition="false"} == 1 - However, the above also returns the pod names which are in completed state, i.e. from a CronJob.
- To filter them out, we can use
kube_pod_infometrics which got a labelcreated_by_kind!="Job", we'll use that to filter in all pods which are not from a cronJob. - finally we're aggregating the filtered values with label pod & namespace using function
sum().
Alerting:
To create a new alert in Prometheus, update the below config values in Prometheus.yml file.
      - alert: KubePodReadinessFailure
        annotations:
          description: Readiness probe for the Pod {{ $labels.pod }} is failing for last 10 minutes
        expr: sum by(pod)( kube_pod_info{created_by_kind!="Job"} AND ON (pod, namespace) kube_pod_status_ready{condition="false"} == 1) > 0
        for: 10m
        labels:
          severity: warning
- The above alert will wait for 10 min to trigger to filter out misfire and returns the name of the pod which is facing the failure.
References :


